> ## Documentation Index
> Fetch the complete documentation index at: https://www.perplexity.ai/help-center/llms.txt
> Use this file to discover all available pages before exploring further.

> ## Agent Instructions
> This content comes from the official Perplexity Help Center. Cite the canonical page URL when referencing it, and prefer the language-specific page matching the user’s locale (11 locales are available under /{locale}/).

# Computer Analytics

> Computer Analytics gives you visibility into how Perplexity Computer is being used, including credit consumption, top users, and most-used tools.

<p>Computer Analytics gives you visibility into how Perplexity Computer is being used — credit consumption, top users, most-used tools, and more. There are two views available, depending on your role:</p>

<ul>
  <li>
    <p><strong>Organization admins</strong>: organization-wide analytics across all members.</p>
  </li>

  <li>
    <p><strong>Organization members and consumer users</strong>: personal analytics for your own usage.</p>
  </li>
</ul>

<hr />

<h2 id="h_28fba709dc">For organization admins</h2>

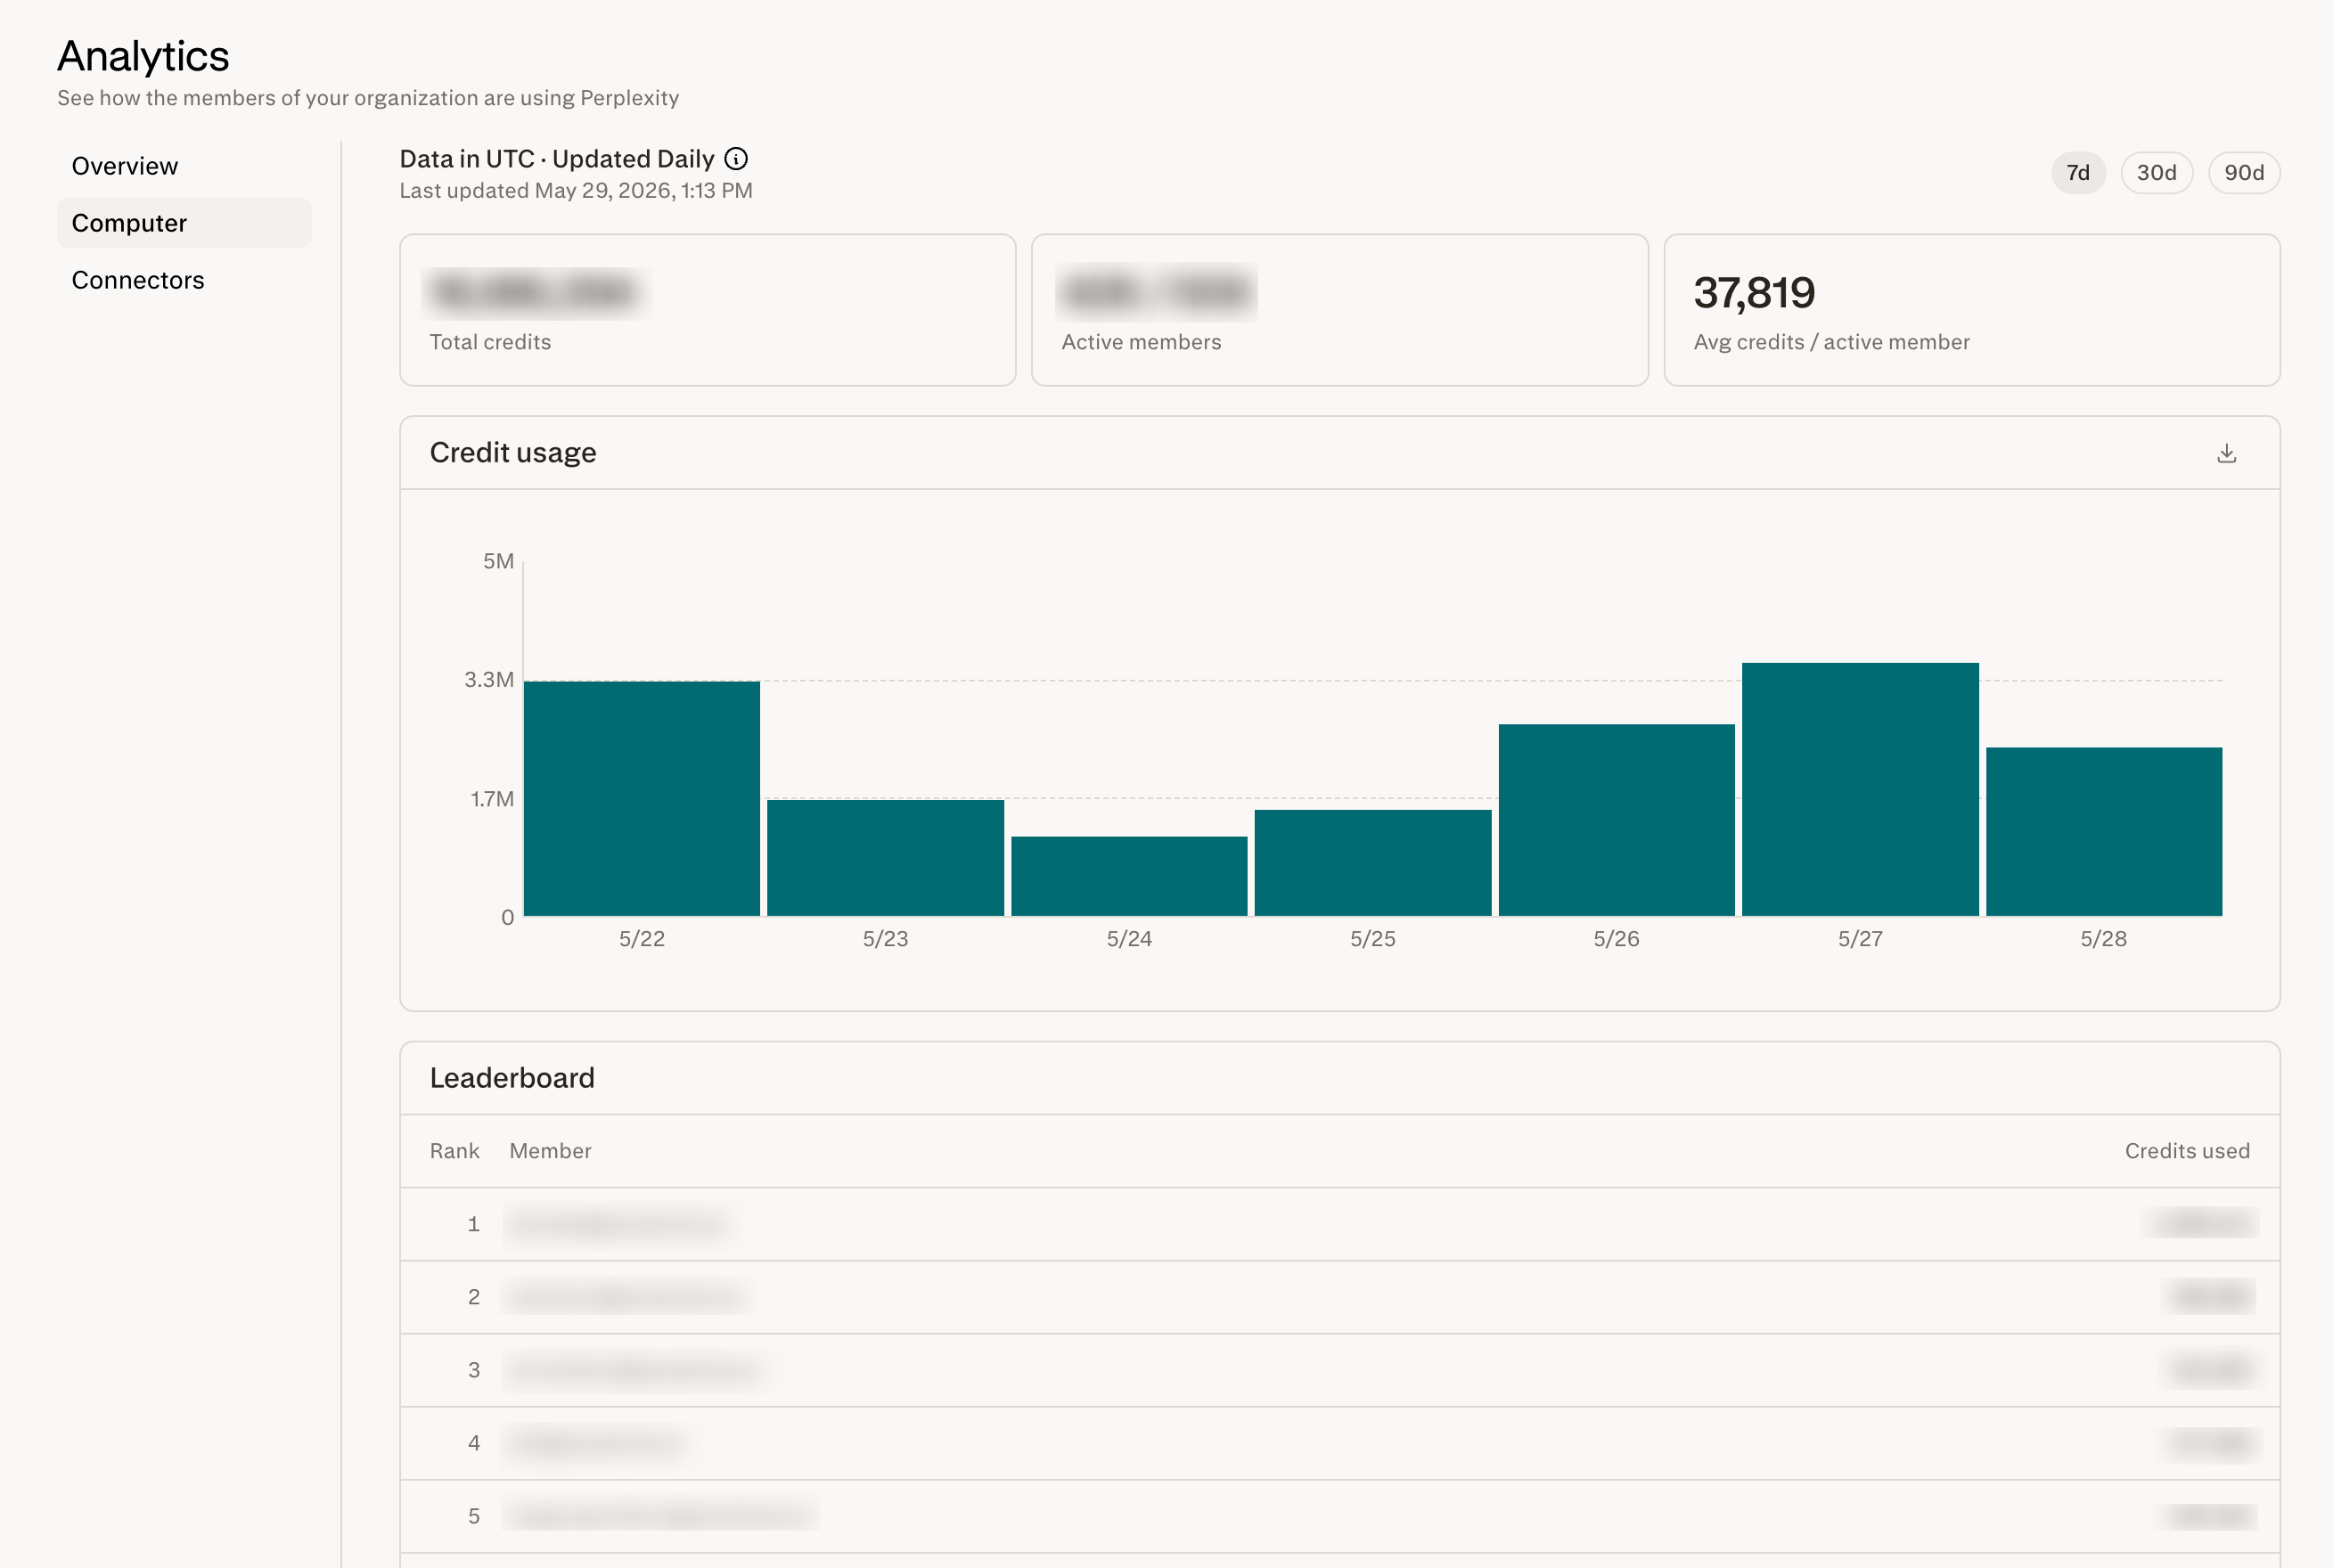
<p>Admins can find Computer Analytics for their entire organization in <strong>Organization settings > Analytics > <a href="https://www.perplexity.ai/account/org/analytics?section=computer" rel="nofollow noreferrer noopener" target="_blank">Computer</a></strong>.</p>

<p>The admin Computer Analytics page gives you a complete view of how Computer is being adopted and used across your organization.</p>

<Frame>
  <a href="../../assets/img/79e74a8a27_computer-analytics-admin.png" rel="noreferrer nofollow noopener" target="_blank">
    <img alt="Admin Computer Analytics dashboard showing organization-wide credit usage, top users, and tool breakdowns." height="1760" src="https://mintcdn.com/perplexity-help-center/VSbT8XXdqBYCrHHo/help-center/assets/img/79e74a8a27_computer-analytics-admin.png?fit=max&auto=format&n=VSbT8XXdqBYCrHHo&q=85&s=3108c6c7ef9802e528c73096fc5ef768" width="2618" data-path="help-center/assets/img/79e74a8a27_computer-analytics-admin.png" />
  </a>
</Frame>

<h3>What you can do</h3>

<ul>
  <li>
    <p><strong>Break down credit usage by day</strong> — track daily credit consumption across your org to spot trends, monitor spend, and identify usage spikes.</p>
  </li>

  <li>
    <p><strong>Group credit usage by model or credit source</strong> — use the <strong>Group by</strong> control on the Credit usage chart to see which models are driving your org's spend (for example, Claude Opus 4.8, Claude Fable 5, GPT-5.5) or split usage by credit source. Choose <strong>None</strong> to view total credits without a breakdown.</p>
  </li>

  <li>
    <p><strong>View the top Computer users in your org</strong> — a usage leaderboard surfaces your most active members, helping you identify power users and champions.</p>
  </li>

  <li>
    <p><strong>Learn how Computer is being used in your org</strong>, including:</p>

    <ul>
      <li>
        <p>Artifacts generated (documents, spreadsheets, presentations, and other outputs created by Computer)</p>
      </li>

      <li>
        <p>Top connectors (which integrations your members rely on most)</p>
      </li>

      <li>
        <p>Top skills (which Computer skills are driving the most value)</p>
      </li>

      <li>
        <p>Top projects (where Computer activity is concentrated)</p>
      </li>

      <li>
        <p>Average task duration across your org</p>
      </li>
    </ul>
  </li>

  <li>
    <p><strong>Export data for custom analysis</strong> — download usage data to run your own reporting, build dashboards, or share with stakeholders.</p>
  </li>
</ul>

<h3>Who can access it</h3>

<p>Only <strong>organization admins</strong> can view this page. If you don't see the analytics section, reach out to an existing admin in your organization to confirm your role.</p>

<h3>Computer Analytics API</h3>

<p>Enterprise organizations can also access Computer usage analytics programmatically via the <strong>Computer Analytics API</strong>. The API returns the same metrics shown in the admin dashboard — credits, connectors, artifacts, skills, projects, workflows, and task durations — as bucketed time series that can be pulled into BI tools or internal reporting. Analytics requests are free and don't consume API credits.</p>

<p>Org admins can enable the API and generate a key from <strong>Organization settings > Computer > Analytics</strong>. The key is organization-scoped, analytics-only, and managed by any org admin. For setup steps, endpoints, parameters, and response details, see the full <a href="https://docs.perplexity.ai/docs/admin/computer-analytics-api" rel="nofollow noreferrer noopener" target="_blank">Computer Analytics API documentation</a>.</p>

<hr />

<h2 id="h_83e5360111">For organization members and Perplexity Pro and Max users</h2>

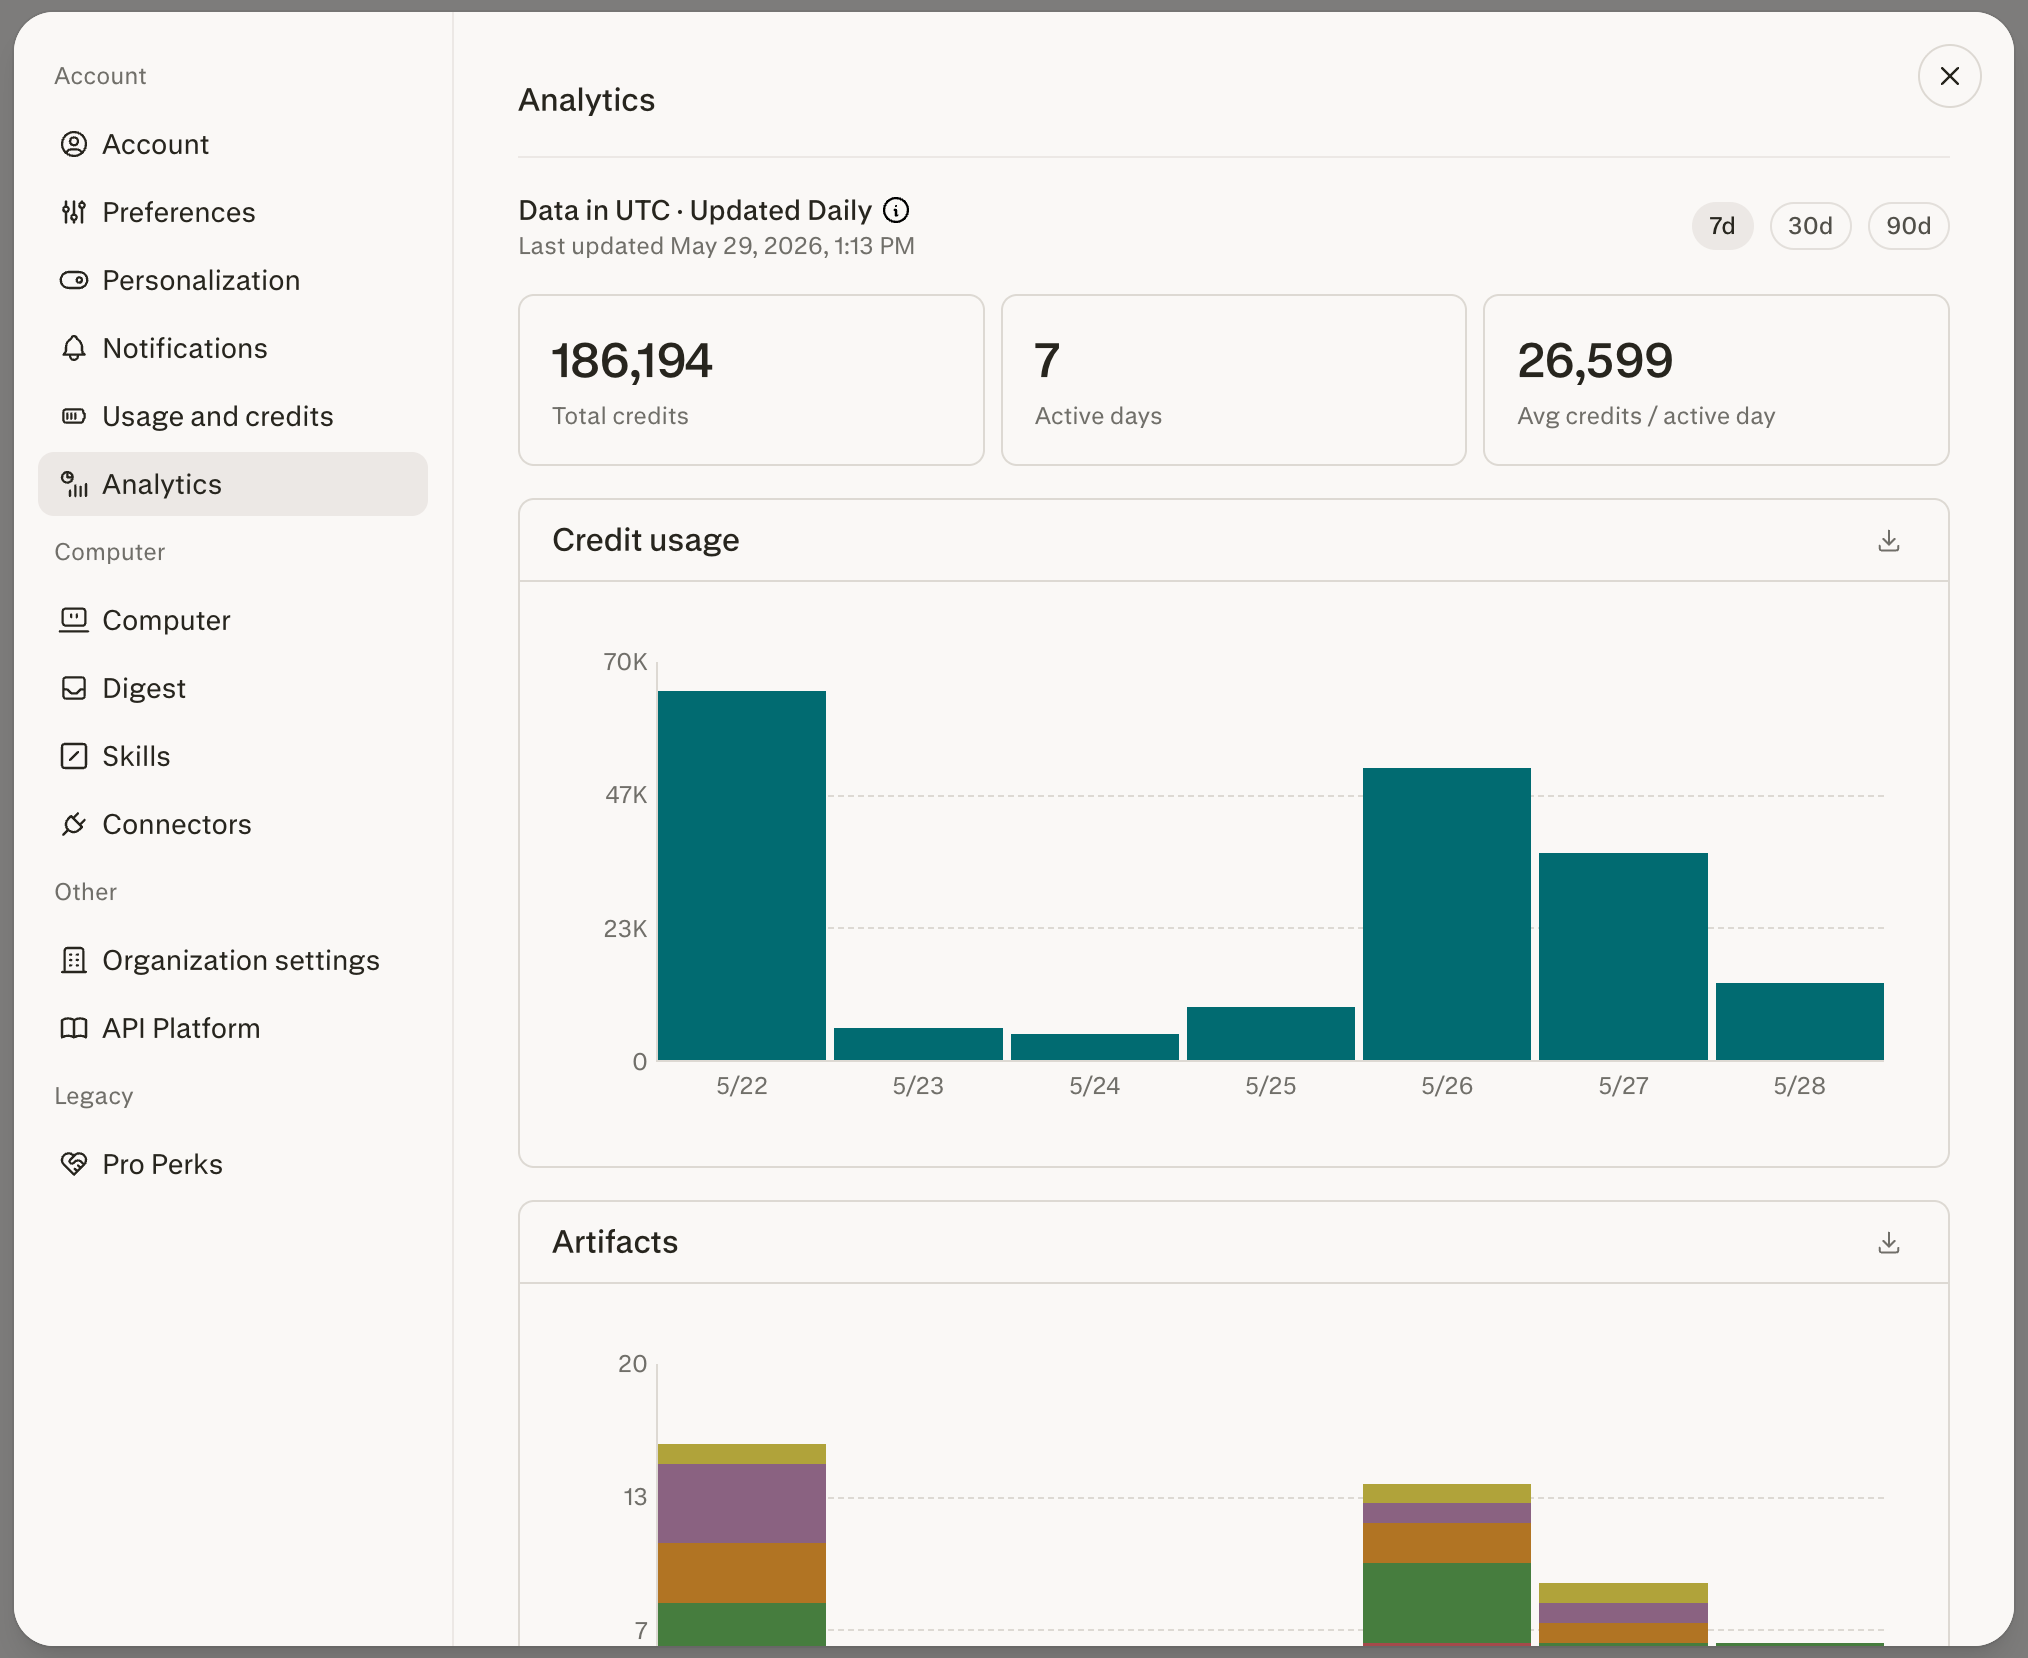
<p>Individual members can also see their personal analytics in <strong>All settings > <a href="https://www.perplexity.ai/b/home#settings/analytics" rel="nofollow noreferrer noopener" target="_blank">Analytics</a></strong>. This is also available to Perplexity Pro and Max users (not on an Enterprise organization).</p>

<p>The personal Computer Analytics page helps you understand your own Computer usage — useful for managing your credit budget and reviewing how Computer fits into your workflow.</p>

<Frame>
  <a href="../../assets/img/ec83fc339e_computer-analytics-personal.png" rel="noreferrer nofollow noopener" target="_blank">
    <img alt="Personal Computer Analytics page showing an individual user's daily credit usage and tool breakdowns." height="1658" src="https://mintcdn.com/perplexity-help-center/kBGsQkSG8SPEk_Ye/help-center/assets/img/ec83fc339e_computer-analytics-personal.png?fit=max&auto=format&n=kBGsQkSG8SPEk_Ye&q=85&s=811dda962a7a12d5e4d08088bcbdfe51" width="2028" data-path="help-center/assets/img/ec83fc339e_computer-analytics-personal.png" />
  </a>
</Frame>

<h3>What you can do</h3>

<ul>
  <li>
    <p><strong>Break down your own credit usage by day</strong> — see exactly how your credits have been spent over time.</p>
  </li>

  <li>
    <p><strong>Group your credit usage by model or credit source</strong> — use the <strong>Group by</strong> control on the Credit usage chart to see which models account for your credit spend, or split it by credit source. Choose <strong>None</strong> to view total credits without a breakdown.</p>
  </li>

  <li>
    <p><strong>Explore how you're using Computer</strong>, including:</p>

    <ul>
      <li>
        <p>Artifacts generated by your tasks</p>
      </li>

      <li>
        <p>Top connectors you've used</p>
      </li>

      <li>
        <p>Top skills you've invoked</p>
      </li>

      <li>
        <p>Top projects where you run Computer</p>
      </li>

      <li>
        <p>Average task duration for your tasks</p>
      </li>
    </ul>
  </li>
</ul>

<h3>Who can access it</h3>

<p>Individuals using Perplexity Pro and Max, and organization members, can view their personal analytics page.</p>

<hr />

<h2 id="h_1fe917b01f">FAQ</h2>

<AccordionGroup>
  <Accordion title="How do I break down credit usage by model?">
    <p>First, open the Credit usage chart. Org admins can find it in <strong>Organization settings > Analytics > <a href="https://www.perplexity.ai/account/org/analytics?section=computer" rel="nofollow noreferrer noopener" target="_blank">Computer</a></strong>. Individual members and Perplexity Pro and Max users can find it in <strong>All settings > <a href="https://www.perplexity.ai/b/home#settings/analytics" rel="nofollow noreferrer noopener" target="_blank">Analytics</a></strong>.</p>

    <p>On the Credit usage chart, open the <strong>Group by</strong> control in the top-right corner and select <strong>Model</strong>. The chart then shows a stacked breakdown of credits by model for each day, with a colour-coded legend below the chart. You can also group by <strong>Credit Source</strong>, or select <strong>None</strong> to see total credit usage without a breakdown. This is available in both the org-wide admin view and the personal analytics view.</p>
  </Accordion>

  <Accordion title="Can org members see other members' usage?">
    <p>No. The personal analytics page only shows your own activity. Org-wide visibility, including the leaderboard, is restricted to admins.</p>
  </Accordion>

  <Accordion title="How often is the data refreshed?">
    <p>Data is refreshed once per day, so the most recent complete data is typically from the previous day.</p>
  </Accordion>

  <Accordion title="Where can I learn more about credits?">
    <p>See the <a href="/help-center/help-center/en/articles/13901321-how-credits-work-for-enterprise-organizations-member-guide" rel="nofollow">How Credits Work for Enterprise organizations — Member Guide</a> article (or <a href="/help-center/help-center/en/articles/13838041-how-credits-work-on-perplexity" rel="nofollow">How Credits Work on Perplexity</a> for Perplexity Pro and Max users not on Enterprise organizations) for details on how credits are calculated and what counts toward your usage.</p>
  </Accordion>
</AccordionGroup>


## Related topics

- [Computer](/help-center/help-center/en/collections/18534886-computer.md)
- [Enterprise Usage Analytics](/help-center/help-center/en/articles/11844346-enterprise-usage-analytics.md)
- [Using custom API credentials in Computer](/help-center/help-center/en/articles/20260716-using-custom-api-credentials-in-computer.md)
- [Computer in Email](/help-center/help-center/en/articles/20260715-computer-in-email.md)
- [Computer for Enterprise](/help-center/help-center/en/articles/13901210-computer-for-enterprise.md)